From Another Think:
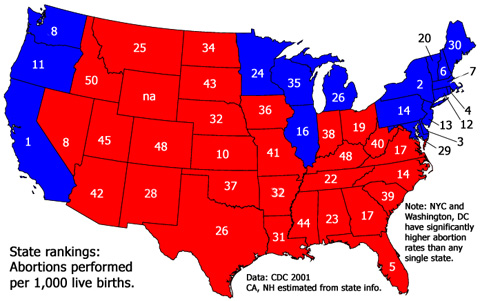
This map ranks states by their abortion rates per 1,000 live births. California ranks highest with approximately 575 abortions for every 1,000 live births; Idaho ranks lowest with only 36 abortions per 1,000. The CDC tracks some cities individually as well as in their state totals: New York City gets the prize with 767 abortions per 1,000, with Washington, D.C., not far behind at 706. To be fair, California cities like Los Angeles and San Francisco may be just as high, but California stopped reporting its abortion statistics to the CDC in 1998, making information about abortions trends there hard to discover (the point, I suppose). Other non-reporting states are New Hampshire and Alaska. Hawaii ranks 23rd. Wyoming's abortion numbers are so low that meaningful statistics are hard to come by. Accurate data would probably rank Wyoming as the state with the fewest abortions in the nation.
Notice that there's a pretty sharp red state/blue state divide with the notable exceptions of Kansas and Florida. This should be no surprise, with Tiller wielding political power in Kansas and the Florida Abortion Council keeping abortion regulations from getting through the state legislature.
4 comments:
Where is the sharp red state/blue state divide? It looks less divided than that to me. The missing California data removed from consideration, the blue states seem lower, all of them, than many of the red states. I haven't yet taken a count, but ... you seem to be interpreting data before you've looked at it.
The state ranking is how HIGH the abortion rate is. So the lower the number, the higher the abortion rate. So look again. Those lowest number states -- California, New York, New Jersey, Massachusetts, etc., are the states with the HIGHEST abortion rates. Those with the highest numbers -- Idaho, Kentucky, Colorado, etc., are the ones with the LOWEST abortion rates.
Oh I see, it is a RANKING not a chart of actual numbers. OK, I see that now. Well, I think actual numbers might be more useful than a first-to-last ranking.
Next issue: the text says NYC "gets the prize" with 767 per 1,000, meaning that three out of four pregnancies resulted in an abortion. I don't think this is correct, not even close.
This data:
http://www.statemaster.com/graph/hea_abo_rat-health-abortion-rate
... shows the abortion rate for NY (State, of course) and Waashington, DC as indeed being the highest, but at a rate of only 30 and 37 per 1,000, respectively.
No matter what your moral or political stand on this issue, I think it would be important to get a better handle on facts and statistics, and to show them in a more useful manner.
On the one hand, the chart I linked you to here supports your argument better, that there is a higher incidence of abortion in "blue states" On the other hand, the Midwest seems to not fall into that pattern so comfortably, a number of red states went blue, and lets be fair: every state is purple, elections have been close and this red state/blue state thing is more divisive than useful.
It might also be noted that for a state like Wyoming, State law and the low population make meaningful data difficult to come by, too.
First of all, let me thank you for doing exactly what I hoped this post would get people doing -- researching and thinking and discussing.
Now, to explain a bit more:
The abortion ratio isn't the number of abortions per 1,000 pregnancies; it's the number of abortions compared to live births. So an abortion ratio of 767 per 1,000 live births is approximately 767 abortions per 1,767 pregnancies. (Some pregnancies end in miscarriage or stillbirth, so it's probably closer to 767 abortions per 2,000 pregnancies.)
The abortion RATE is the number of abortions per 1,000 women of childbearing age.
Post a Comment